Creates a stratified random sample of an sp class object
stratified.random(x, strata, n = 10, reps = 1, replace = TRUE)
Arguments
| x | sp class SpatialDataFrame object (point, polygon, line, pixel) |
|---|---|
| strata | Column in @data slot with stratification factor |
| n | Number of random samples |
| reps | Number of replicates per strata |
| replace | Sampling with replacement (TRUE|FALSE) |
Value
sp SpatialDataFrame object (same as input feature) containing random samples
Note
If replace=FALSE features are removed from consideration in subsequent replicates. Conversely, if replace=TRUE, a feature can be selected multiple times across replicates. Not applicable if rep=1.
Depends: sp
References
Hudak, A.T., N.L. Crookston, J.S. Evans, M.J. Falkowski, A.M.S. Smith, P. Gessler and P. Morgan. (2006) Regression modelling and mapping of coniferous forest basal area and tree density from discrete-return lidar and multispectral satellite data. Canadian Journal of Remote Sensing 32: 126-138.
Author
Jeffrey S. Evans <jeffrey_evans@tnc.org>
Examples
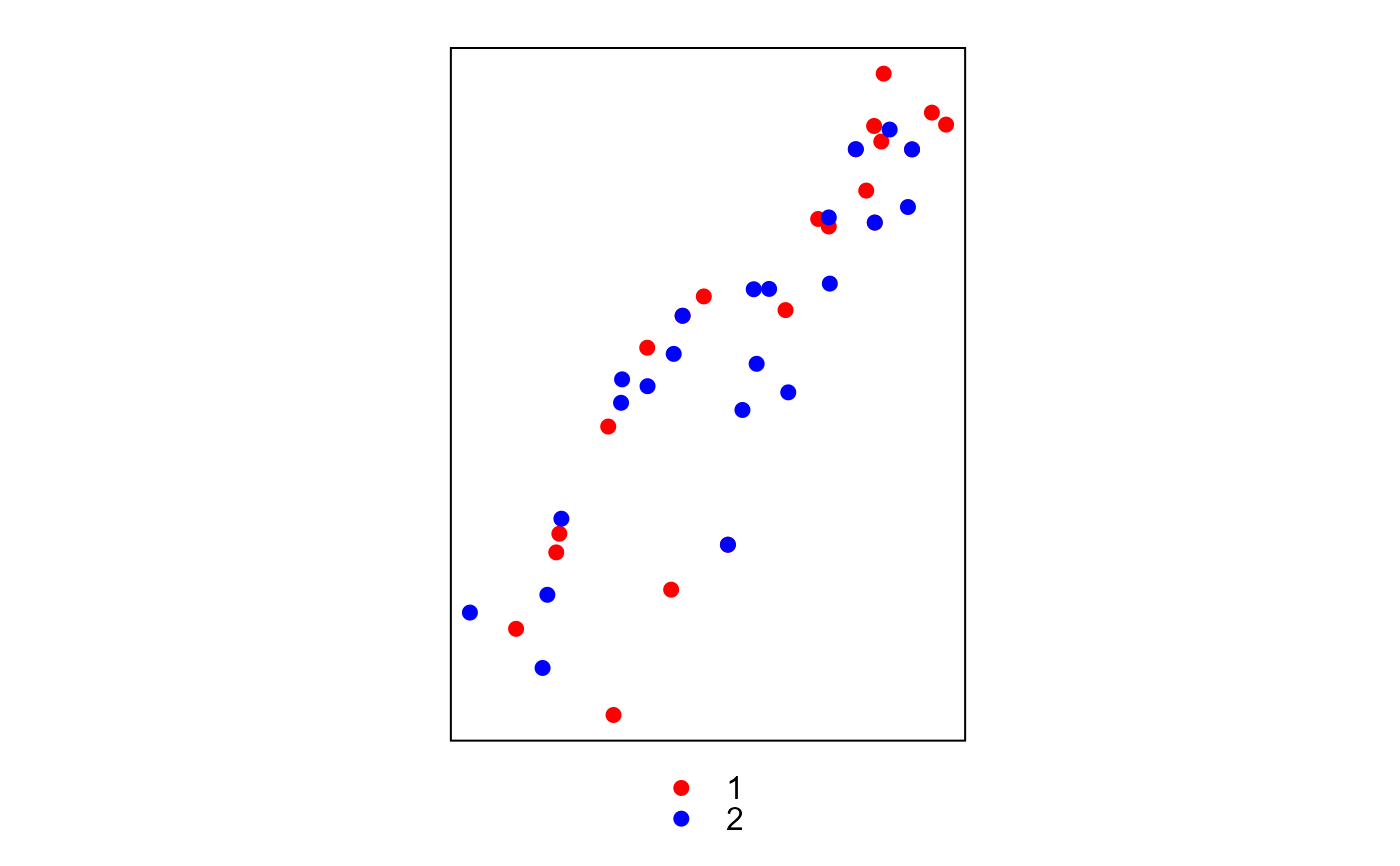
require(sp) data(meuse) coordinates(meuse) <- ~x+y # Create stratified variable using quartile breaks x1 <- cut(meuse@data[,'cadmium'], summary(meuse@data[,'cadmium'])[-4], include.lowest=TRUE) levels(x1) <- seq(1,nlevels(x1),1) x2 <- cut(meuse@data[,'lead'], summary(meuse@data[,'lead'])[-4], include.lowest=TRUE) levels(x2) <- seq(1,nlevels(x2),1) meuse@data <- cbind(meuse@data, STRAT=paste(x1, x2, sep='.') ) # 2 replicates and replacement ssample <- stratified.random(meuse, strata='STRAT', n=2, reps=2) # 2 replicates and no replacement ssample.nr <- stratified.random(meuse, strata='STRAT', n=2, reps=2, replace=FALSE) # n=1 and reps=10 for sequential numbering of samples ssample.ct <- stratified.random(meuse, strata='STRAT', n=1, reps=10, replace=TRUE) # Counts for each full strata (note; 2 strata have only 1 observation) tapply(meuse@data$STRAT, meuse@data$STRAT, length)#> 1.1 1.2 1.3 2.1 2.2 2.3 2.4 3.2 3.3 3.4 4.3 4.4 #> 28 12 1 11 21 8 1 6 17 11 13 26# Counts for each sampled strata, with replacement tapply(ssample@data$STRAT, ssample@data$STRAT, length)#> 1.1 1.2 1.3 2.1 2.2 2.3 2.4 3.2 3.3 3.4 4.3 4.4 #> 4 4 2 4 4 4 2 4 4 4 4 4# Counts for each sampled strata, without replacement tapply(ssample.nr@data$STRAT, ssample.nr@data$STRAT, length)#> 1.1 1.2 1.3 2.1 2.2 2.3 2.4 3.2 3.3 3.4 4.3 4.4 #> 4 4 1 4 4 4 1 4 4 4 4 4# Counts for each sampled strata, without replacement tapply(ssample.ct@data$STRAT, ssample.ct@data$STRAT, length)#> 1.1 1.2 1.3 2.1 2.2 2.3 2.4 3.2 3.3 3.4 4.3 4.4 #> 10 10 10 10 10 10 10 10 10 10 10 10# Plot random samples colored by replacement ssample@data$REP <- factor(ssample@data$REP) spplot(ssample, 'REP', col.regions=c('red','blue'))
