Uses row imputation to identify "k" ecological similar observations
similarity(
  x,
  k = 4,
  method = "mahalanobis",
  frequency = TRUE,
  scale = TRUE,
  ID = NULL
)
Arguments
| x | data.frame containing ecological measures |
|---|---|
| k | Number of k nearest neighbors (kNN) |
| method | Method to compute multivariate distances c("mahalanobis", "raw", "euclidean", "ica") |
| frequency | Calculate frequency of each reference row (TRUE/FALSE) |
| scale | Scale multivariate distances to standard range (TRUE/FALSE) |
| ID | Unique ID vector to use as reference ID's (rownames). Must be unique and same length as number of rows in x |
Value
data.frame with k similar targets and associated distances. If frequency = TRUE the freq column represents the number of times a row (ID) was selected as a neighbor.
Note
This function uses row-based imputation to identify k similar neighbors for each observation. Has been used to identify offsets based on ecological similarity.
References
Evans, J.S., S.R. Schill, G.T. Raber (2015) A Systematic Framework for Spatial Conservation Planning and Ecological Priority Design in St. Lucia, Eastern Caribbean. Chapter 26 in Central American Biodiversity : Conservation, Ecology and a Sustainable Future. F. Huettman (eds). Springer, NY.
Author
Jeffrey S. Evans <jeffrey_evans@tnc.org>
Examples
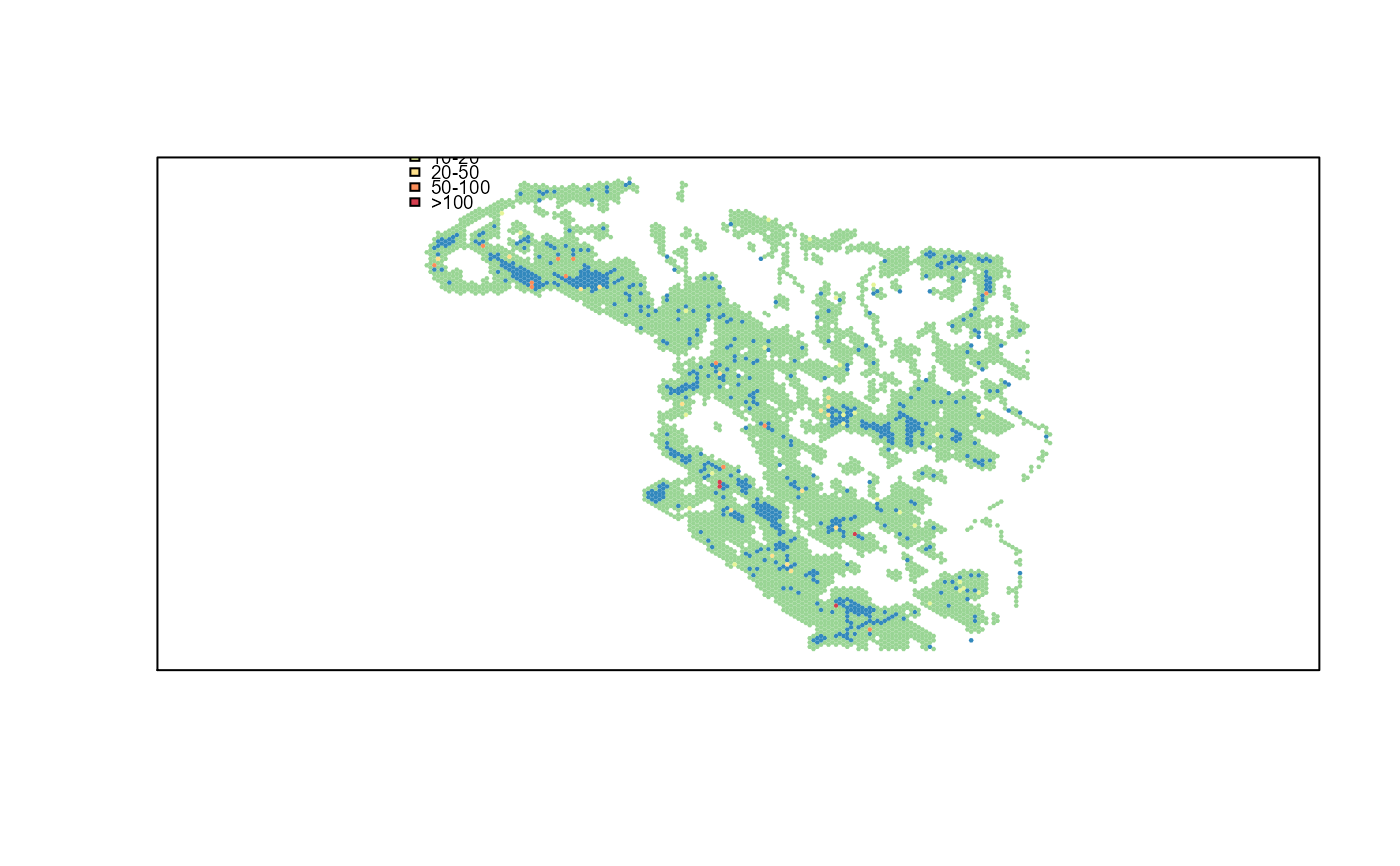
library(sp) data(pu) kNN <- similarity(pu@data[2:ncol(pu)], k = 4, frequency = FALSE, ID = pu@data$UNIT_ID) # \donttest{ kNN <- similarity(pu@data[2:ncol(pu)], k = 4, frequency = TRUE, ID = pu@data$UNIT_ID) p <- kNN$freq clr <- c("#3288BD", "#99D594", "#E6F598", "#FEE08B", "#FC8D59", "#D53E4F") p <- ifelse(p <= 0, clr[1], ifelse(p > 0 & p < 10, clr[2], ifelse(p >= 10 & p < 20, clr[3], ifelse(p >= 20 & p < 50, clr[4], ifelse(p >= 50 & p < 100, clr[5], ifelse(p >= 100, clr[6], NA)))))) plot(pu, col=p, border=NA)legend("topleft", legend=c("None","<10","10-20", "20-50","50-100",">100"), fill=clr, cex=0.6, bty="n")# }