Calculates entropy on integer raster (i.e., 8 bit 0-255)
Entropy calculated as: H = -sum(Pi*ln(Pi)) where; Pi, Proportion of one value to total values Pi=n(p)/m and m, Number of unique values. Expected range: 0 to log(m) H=0 if window contains the same value in all cells. H increases with the number of different values in the window.
Maximum entropy is reached when all values are different, same as log(m) max.ent <- function(x) log( length( unique(x) ) )
raster.entropy(
  x,
  d = 5,
  categorical = FALSE,
  global = FALSE,
  filename = FALSE,
  ...
)
Arguments
| x | Object of class raster (requires integer raster) |
|---|---|
| d | Size of matrix (window) |
| categorical | Is the data categorical or continuous (FALSE/TRUE) |
| global | Should the model use a global or local n to calculate entropy (FALSE/TRUE) |
| filename | Raster file written to disk |
| ... | Optional arguments passed to writeRaster or dataType |
Value
raster class object or specified format raster written to disk
References
Fuchs M., R. Hoffmann, F. Schwonke (2008) Change Detection with GRASS GIS - Comparison of images taken by different sensor.
Examples
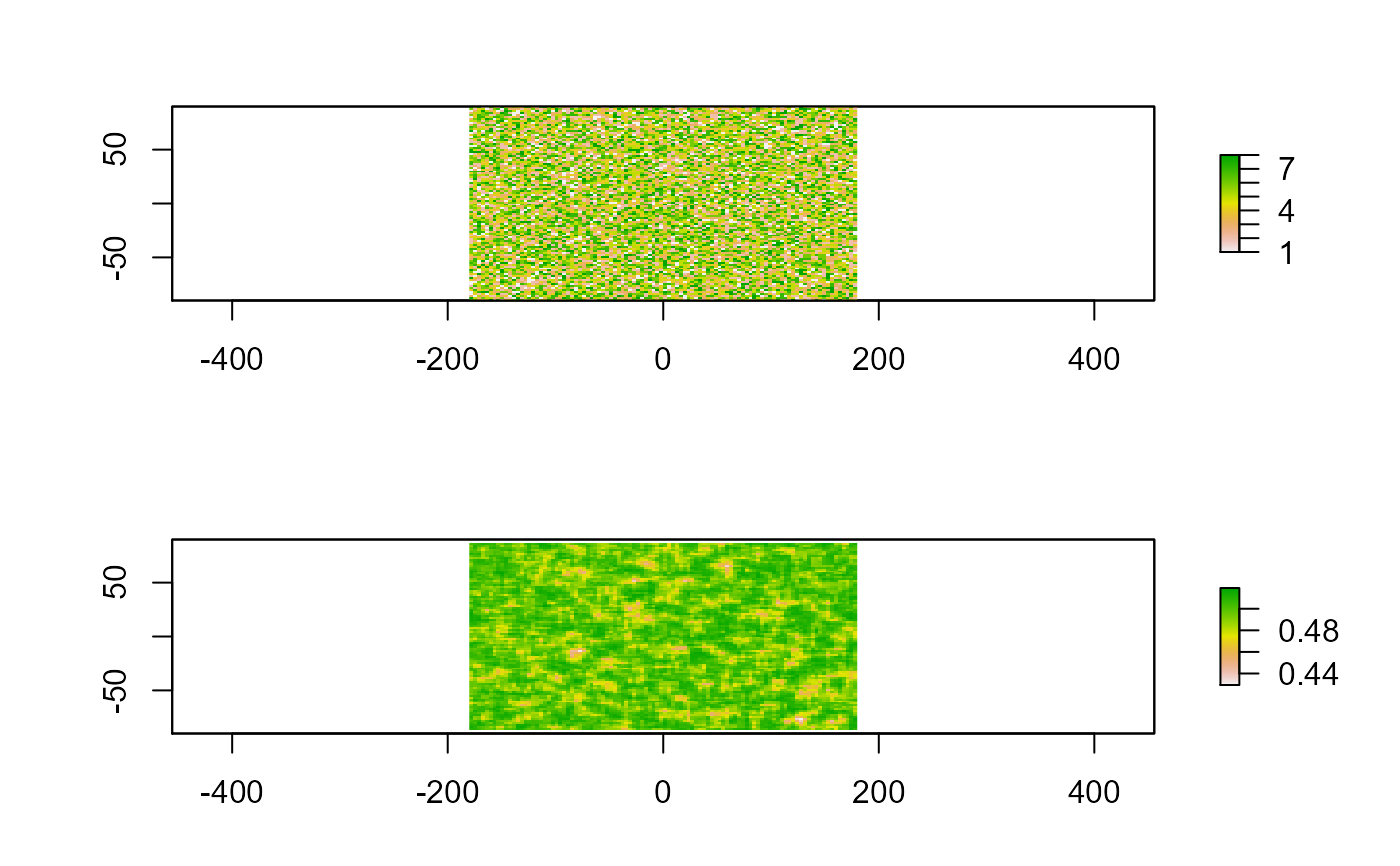
require(raster) r <- raster(ncols=100, nrows=100) r[] <- round(runif(ncell(r), 1,8), digits=0) rEnt <- raster.entropy(r, d=5, categorical = TRUE, global = TRUE) opar <- par(no.readonly=TRUE) par(mfcol=c(2,1)) plot(r) plot(rEnt)
