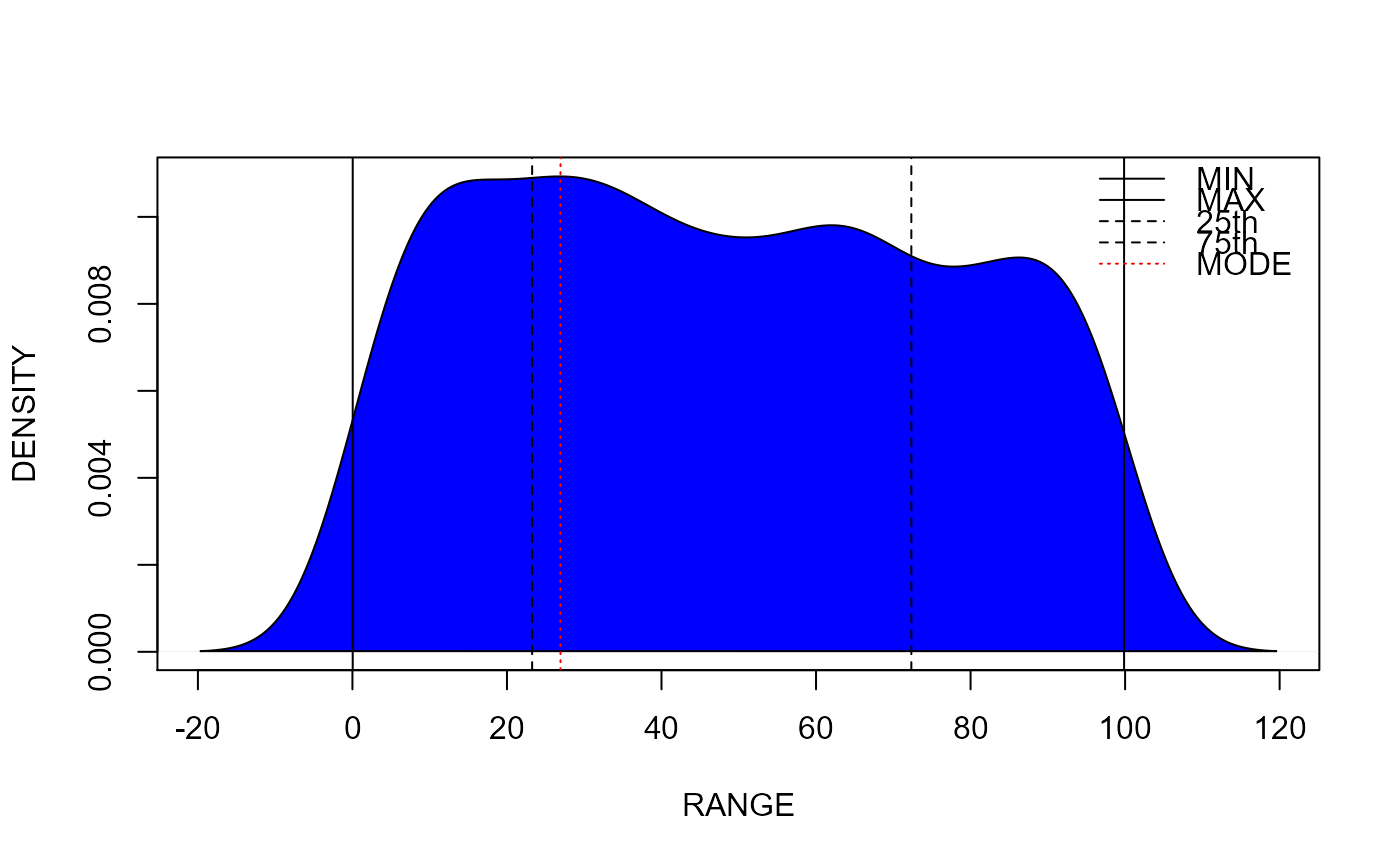
Calculate statistical moments of a distribution
moments(x, plot = FALSE)
Arguments
| x | numeric vector |
|---|---|
| plot | plot of distribution (TRUE/FALSE) |
Value
A vector with the following values:
min Minimum
25th 25th percentile
mean Arithmetic mean
gmean Geometric mean
hmean Harmonic mean
median 50th percentile
7th5 75th percentile
max Maximum
stdv Standard deviation
var Variance
cv Coefficient of variation (percent)
mad Median absolute deviation
skew Skewness
kurt Kurtosis
nmodes Number of modes
mode Mode (dominate)
Author
Jeffrey S. Evans jeffrey_evans@tnc.org
Examples
#> min 25th mean hmean gmean median #> 0.03595504 23.25769317 48.30850831 10.28245797 35.03625649 46.83070404 #> 75th max stdv var cv mad #> 72.33565453 99.86989077 29.05190045 844.01291982 60.13826853 36.24171848 #> skew kurt nmodes mode #> 0.09909515 -1.20418387 3.00000000 26.92783441( mode.x <- moments(x, plot=FALSE)[16] )#> mode #> 26.92783
