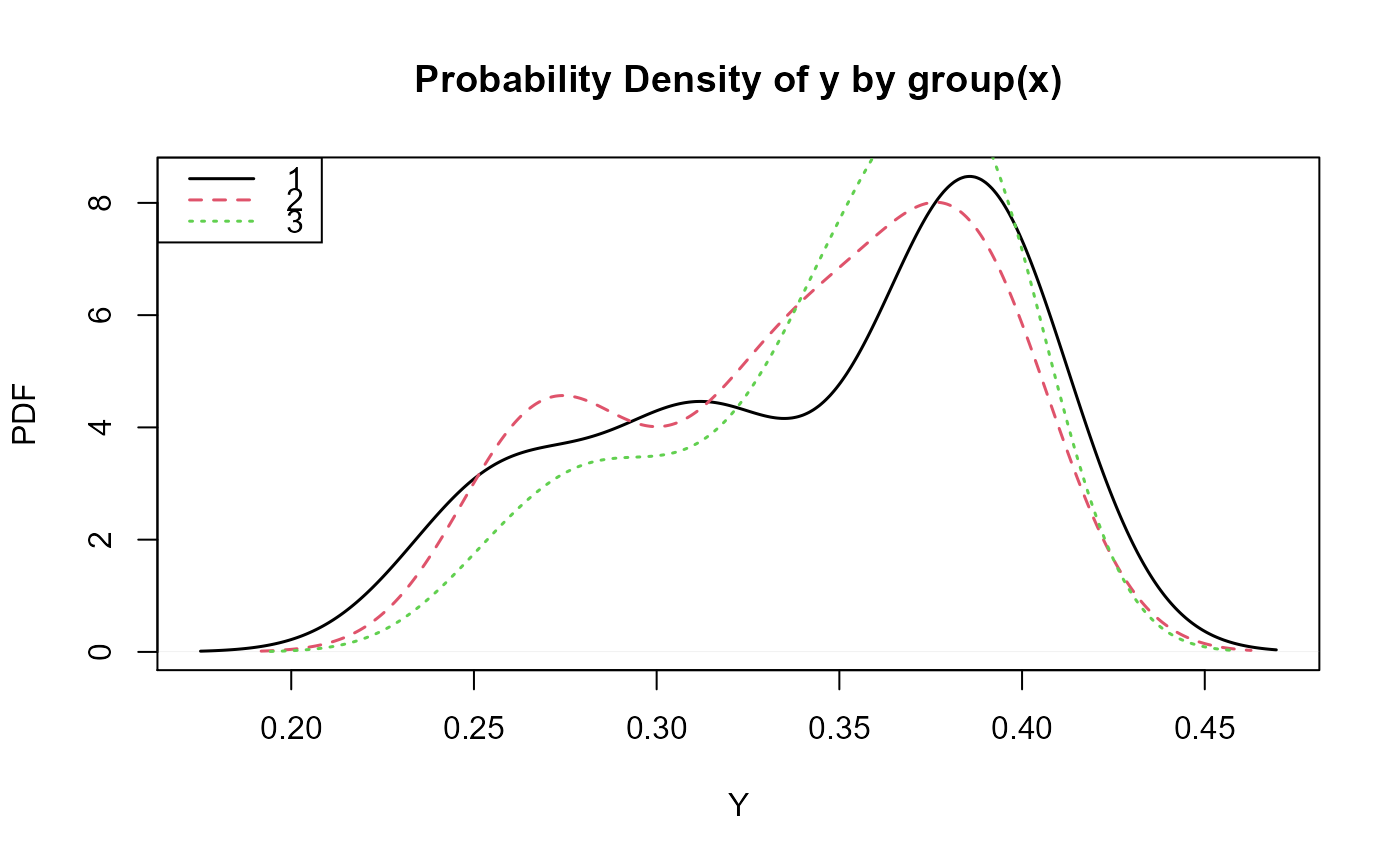
Creates a probability density plot of y for each group of x
group.pdf(
  x,
  y,
  col = NULL,
  lty = NULL,
  lwd = NULL,
  lx = "topleft",
  ly = NULL,
  ...
)
Arguments
| x | Numeric, character or factorial vector of grouping variable (must be same length as y) |
|---|---|
| y | Numeric vector (density variable) |
| col | Optional line colors (see par, col) |
| lty | Optional line types (see par, lty) |
| lwd | Optional line widths (see par, lwd) |
| lx | Position of legend (x coordinate or 'topright', 'topleft', 'bottomright', 'bottomleft') |
| ly | Position of legend (y coordinate) |
| ... | Additional arguments passed to plot |
References
Simonoff, J. S. (1996). Smoothing Methods in Statistics. Springer-Verlag, New York.
Author
Jeffrey S. Evans <jeffrey_evans<at>tnc.org>
Examples
y=dnorm(runif(100))
x=rep(c(1,2,3), length.out=length(y))
group.pdf(x=as.factor(x), y=y, main='Probability Density of y by group(x)',
ylab='PDF', xlab='Y', lty=c(1,2,3))