Calculates the dispersion ("rarity") of targets associated with planning units
dispersion(x)
Arguments
| x | data.frame object of target values |
|---|
Value
data.frame with columns H values for each target, H , sH, sHmax
Note
The dispersion index (H-prime) is calculated H = sum( sqrt(p) / sqrt(a) ) where; P = [sum of target in planning unit / sum of target across all planning units] and a = [count of planning units containing target / number of planning units]
References
Evans, J.S., S.R. Schill, G.T. Raber (2015) A Systematic Framework for Spatial Conservation Planning and Ecological Priority Design in St. Lucia, Eastern Caribbean. Chapter 26 in Central American Biodiversity : Conservation, Ecology and a Sustainable Future. F. Huettman (eds). Springer, NY.
Author
Jeffrey S. Evans <jeffrey_evans@tnc.org>
Examples
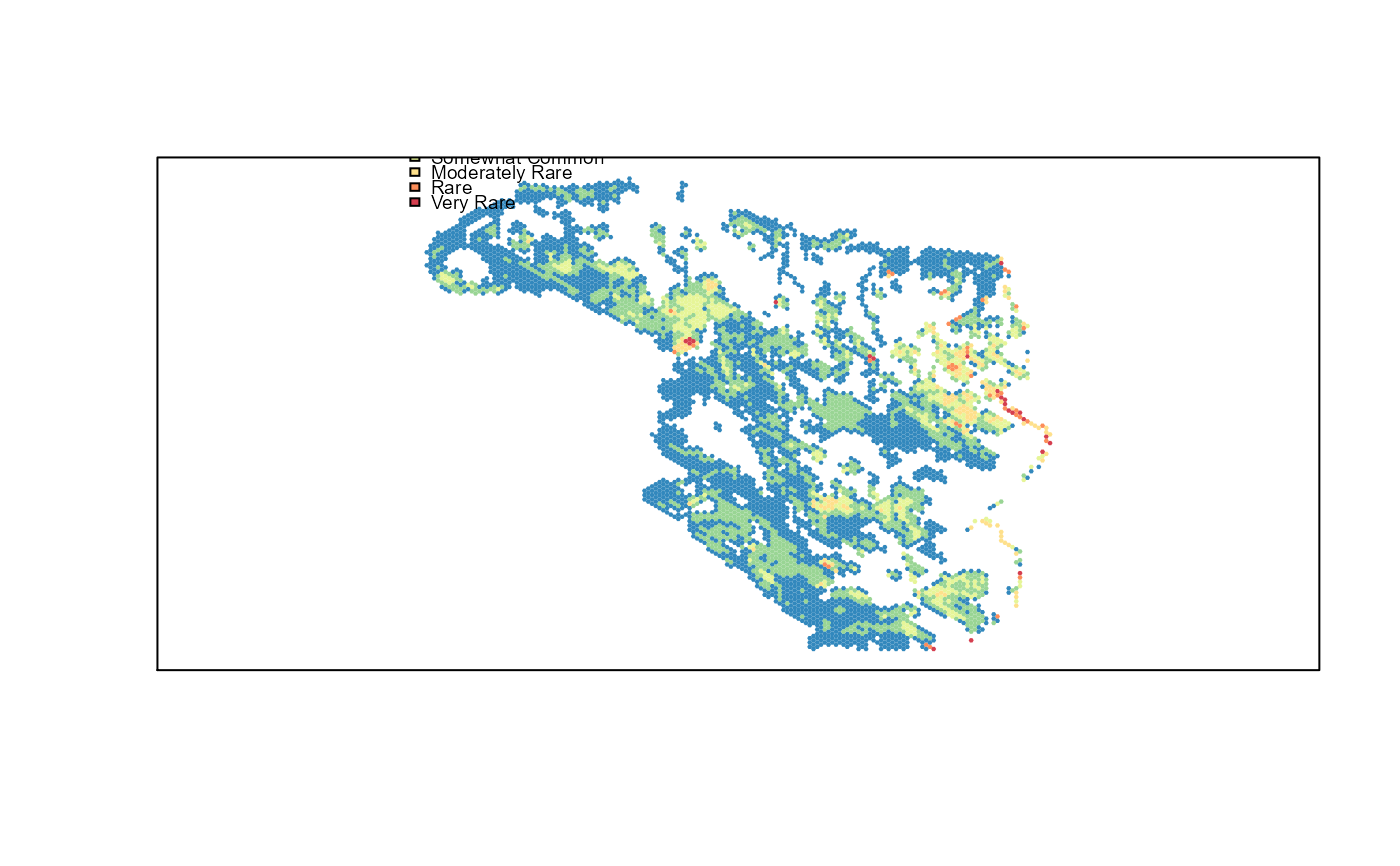
# \donttest{ library(sp) data(pu) d <- dispersion(pu@data[,2:ncol(pu)]) p <- d[,"H"] clr <- c("#3288BD", "#99D594", "#E6F598", "#FEE08B", "#FC8D59", "#D53E4F") clrs <- ifelse(p < 0.5524462, clr[1], ifelse(p >= 0.5524462 & p < 1.223523, clr[2], ifelse(p >= 1.223523 & p < 2.465613, clr[3], ifelse(p >= 2.465613 & p < 4.76429, clr[4], ifelse(p >= 4.76429 & p < 8.817699, clr[5], ifelse(p >= 8.817699, clr[6], NA)))))) plot(pu, col=clrs, border=NA)legend("topleft", legend=rev(c("Very Rare","Rare","Moderately Rare", "Somewhat Common","Common","Over Dispersed")), fill=clr, cex=0.6, bty="n")# }