Finds class breaks in a distribution
classBreaks(x, n, type = c("equal", "quantile", "std", "geometric"))
Arguments
| x | A vector to find breaks for |
|---|---|
| n | Number of breaks |
| type | Statistic used to find breaks c("equal", "quantile", "std", "geometric") |
Value
A vector containing class break values the length is n+1 to allow for specification of ranges
Note
The robust std method uses sqrt(sum(x^2)/(n-1)) to center the data before deriving "pretty" breaks.
Author
Jeffrey S. Evans <jeffrey_evans@tnc.org>
Examples
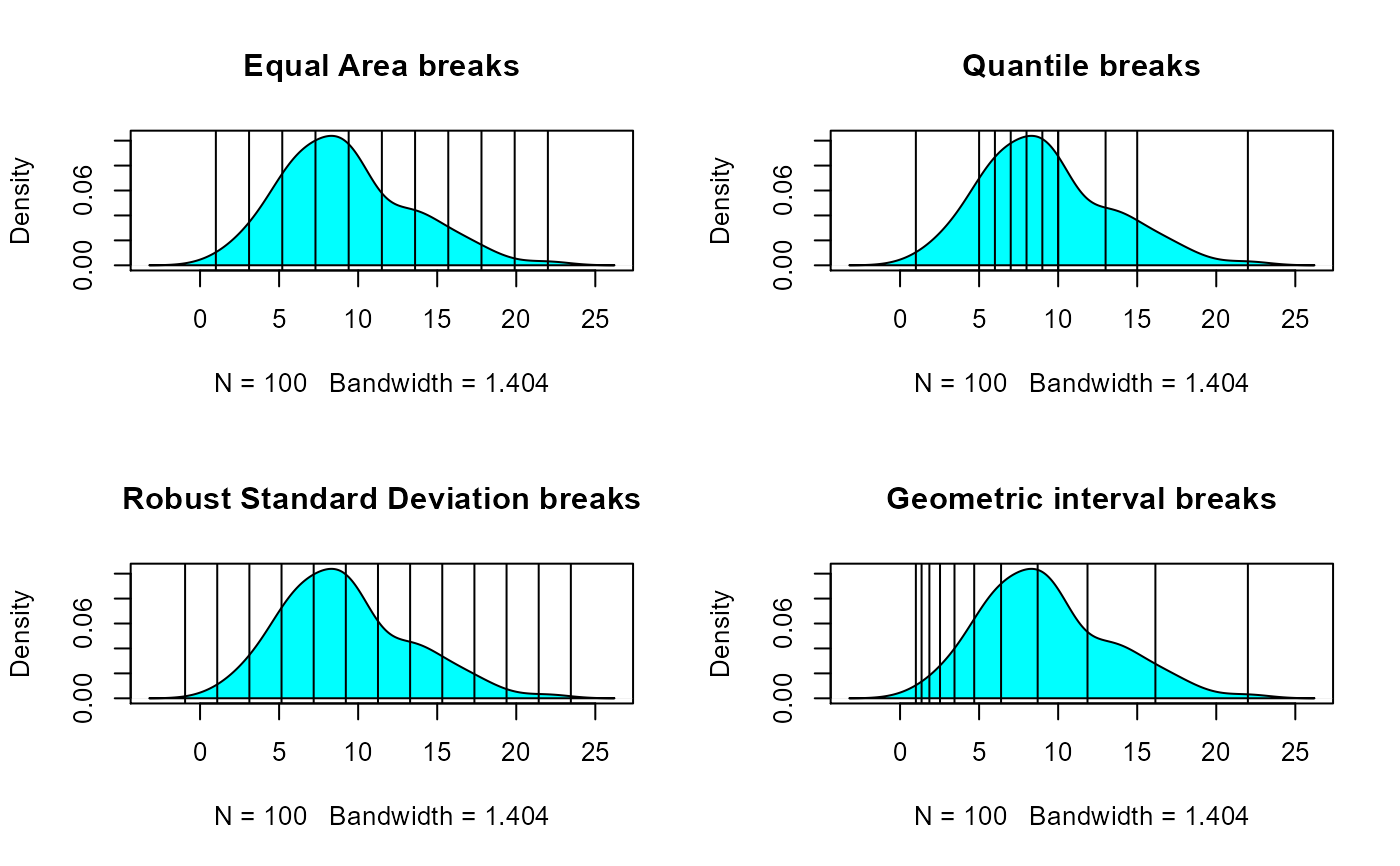
#> [1] 1.0 3.1 5.2 7.3 9.4 11.5 13.6 15.7 17.8 19.9 22.0classBreaks(y, 10, type="quantile")#> 0% 10% 20% 30% 40% 50% 60% 70% 80% 90% 100% #> 1 5 6 7 8 9 10 10 13 15 22opar <- par(no.readonly=TRUE) par(mfrow=c(2,2)) d <- density(y) plot(d, type="n", main="Equal Area breaks") polygon(d, col="cyan") abline(v=classBreaks(y, 10)) plot(d, type="n", main="Quantile breaks") polygon(d, col="cyan") abline(v=classBreaks(y, 10, type="quantile")) plot(d, type="n", main="Robust Standard Deviation breaks") polygon(d, col="cyan") abline(v=classBreaks(y, 10, type="std")) plot(d, type="n", main="Geometric interval breaks")#> [1] 1.0 3.1 5.2 7.3 9.4 11.5 13.6 15.7 17.8 19.9 22.0#> [1] 4 3 2 6 3 3 4 5 3 4 6 4 3 4 7 2 3 7 4 1 7 2 6 4 7 #> [26] 3 4 1 4 2 4 1 4 7 5 2 6 4 4 6 7 9 2 3 8 5 3 3 2 7 #> [51] 3 6 5 5 6 8 9 2 2 4 3 2 5 1 8 4 2 4 3 3 5 5 3 10 8 #> [76] 5 5 3 4 3 4 5 5 1 5 3 6 1 3 5 7 5 4 4 4 5 4 6 8 3 #> Levels: 1 2 3 4 5 6 7 8 9 10